Markus Schläfli
Measuring cache misses on macOS with Instruments
Code for the post can be found here.
While working on the basic implementation for matmul in the Deep Learning from Scratch post, I was curious to get some basic cache miss numbers for seeing how bad iterating by column is when the matrices are stored in row-major order.
While Linux has the perf CLI tool to access hardware performance counters, macOS uses Instruments for a whole range of performance analysis tasks. I didn’t find many helpful docs about cache misses online - especially ones for Apple silicon - so I thought I’d put together a little something.
For those who want spoilers, I profile the following examples for cache misses:
- Iterating a list vs random indexing
- Summing a row-major order matrix by row vs by column.
- Looking at Array-Of-Structs vs Struct-Of-Arrays.
- Naïve vs tiled matmul.
Setup
Instruments comes with Xcode, so everything should already be available right out of the box. I am of course assuming that Xcode is installed on the machine in the first place.
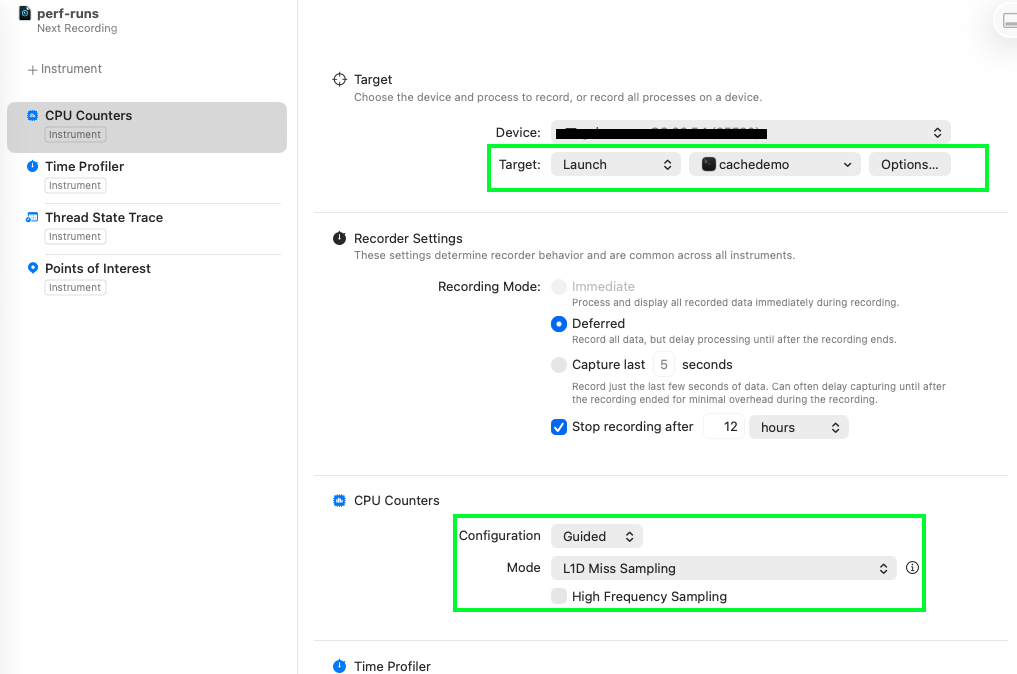
When you first open Instruments, you are greeted with a dialog asking you to choose a template. Think of Instruments as having a large amount of tools available to measure performance in a myriad of ways, and choosing a template just selects a handful of those tools for you.

Seeing as we will be measuring cache misses, we want to select CPU Counters, giving us access to hardware performance counters or Performance Monitoring Counters (PMCs). These are low-level registers built directly into the silicon that give us extremely accurate information with minimal overhead, though the fact that they really are just counters means that it’s not always as straightforward to understanding your problem compared with code instrumentation or sampling profilers when trying to figure out where the program is spending its time.
Selecting the CPU counters takes us to the main view of Instruments, showing the tools and options for each of them. We need to point it to the binary - I’ve called this cachedemo throughout this tutorial - and we can use the Guided L1D Miss Sampling mode (alternatively the manual mode requires us to choose from a large list of options). It would be nice to also get data on the L2 cache, but we need to think first about how our algorithms affect the L1.
Next we need some code, so let’s start with the most minimal C code and run it in the profiler to understand what’s happening.
int main() {
  return 0;
}
// compile with $ clang main.c -o main
That is a lot of misses
Running the basic program gives us 25k L1 cache load misses, 16 context switches, and the entire program takes 3/4 of a second to run. Um, what?
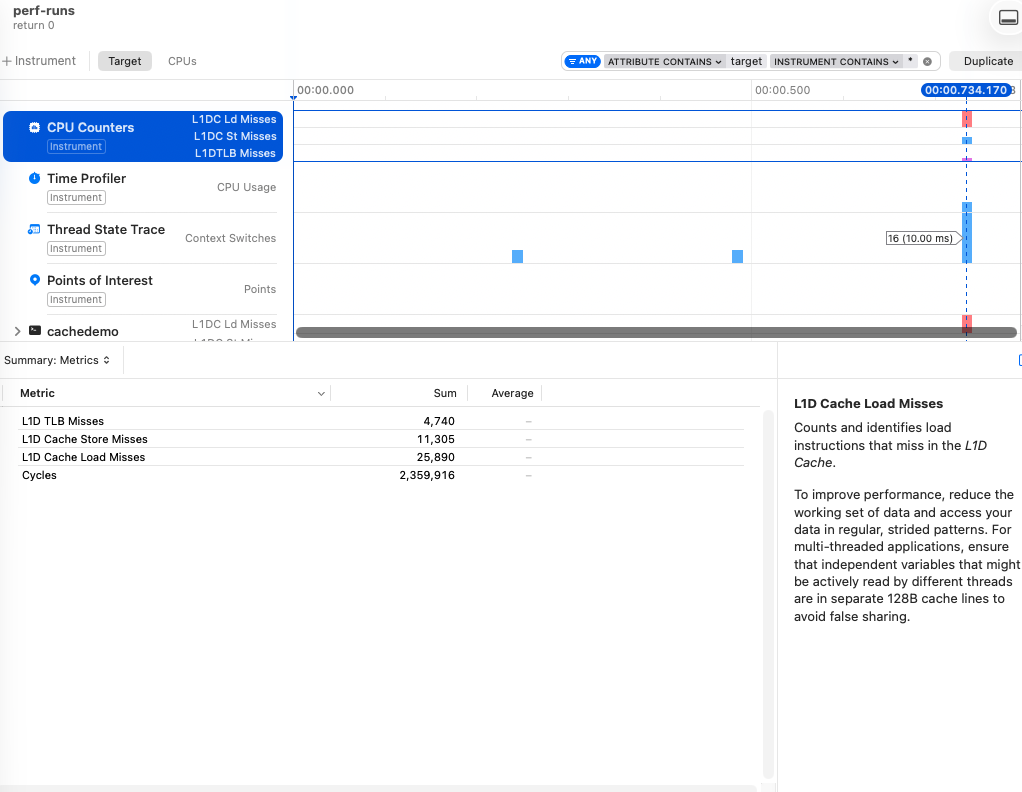
There’s a lot that goes on in order for the OS to run your program: the dynamic linker maps the C runtime and shared libraries; your own code and the .data segment are pulled from disk; and the stack, heap, and .bss are set up in memory. And the first time all of this is touched it has to be brought through the entire memory hierarchy, meaning it’s a cache + page + TLB miss. This makes sense, but the cold start of the program isn’t great for us trying to understand how cache misses affect a particular part of the code.
Adding sleep
To help isolate our code within the larger program, we can add a few sleep calls around the interesting parts. Adding one sleep(1) before our return gives us the following:
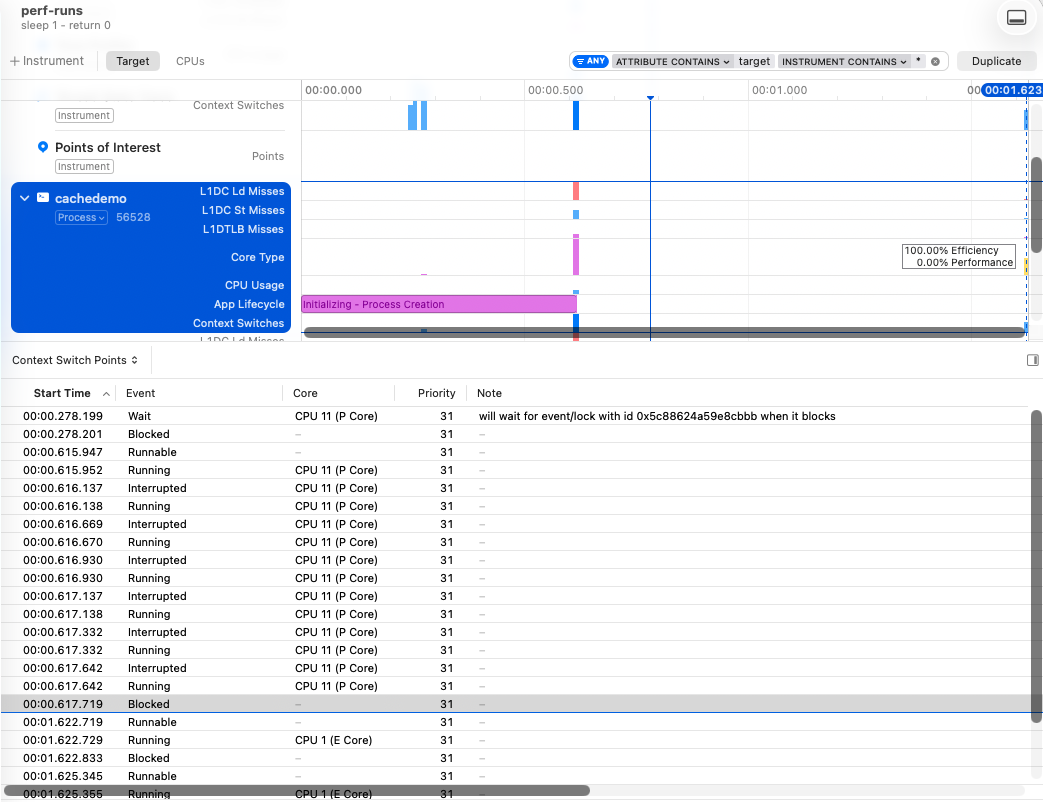
I’ve highlighted the “Core Type” with a mouse-over, and I’ve selected the “Context Switch Points” in the bottom panel. Both of these show something interesting: after we return from our sleep, our program is placed on an efficiency core.
This matters if we are trying to work with specific cache sizes because P and E cores don’t have the same resources. A performance core on my M3 Max has 128 kB and the efficiency core has 64 kB. Both have a cache line size of 128 bytes.
$ sysctl -a | grep l1dcache
hw.perflevel1.l1dcachesize: 65536
hw.perflevel0.l1dcachesize: 131072

$ sysctl hw.cachelinesize
hw.cachelinesize: 128
That’s all the important stuff out of the way, let’s get some real examples now.
Helper tooling
We’ll be needing the following functions throughout our code. We allocate memory but then we immediately write to it, forcing the pages to be loaded. Without this, malloc will just ‘reserve’ the memory, but it won’t be loaded until we write to it. In order to make it generic, we allocate any size, and then write the numbers 0..255 in each byte (meaning the 1st 32-bit integer would be 00000000 00000001 00000010 00000011 or 66051 in base 10, although it’s 50462976 because my system is little-endian). Additionally, we add a sleep version as we’ll be using the sleep function to isolate our code and allow us to see just our code in the timeline.
void *mallocFill(size_t n) {
  char *m = malloc(n);
  for (size_t i = 0; i < n; i++)
    m[i] = i % 256;
  return m;
}

void *mallocFillSleep(size_t n) {
  void *m = mallocFill(n);
  sleep(1);
  return m;
}
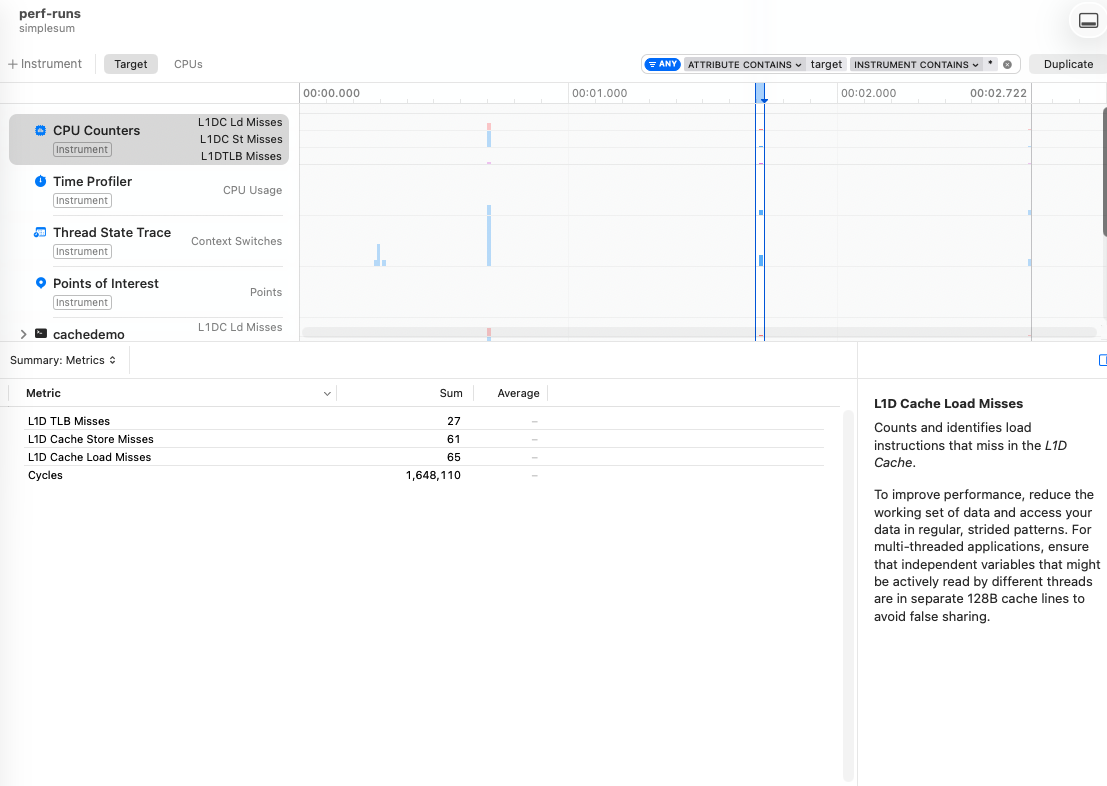
Iterating a list vs random indexing
The most trivial example I can think of to get a feeling of how significant the total number of cache misses can be for a problem with multiple implementations is just iterating a list in order, vs randomly.
We’ll do this with a 1 MB array, using rand() for the random indexing, meaning these aren’t functionally equivalent pieces of code, but they give us the same number of total memory accesses. 1 MB also means it’s too much data to hold in the L1 cache of 128 kB (P-core) or 64 kB (E-core).
int n = 256 * 1024; // 1MB
int *m = mallocFillSleep(n * sizeof(int));

// iterate in order
int sum = 0;
for (int i = 0; i < n; i++) {
  sum += m[i];
}

// iterate in random order
int sum2 = 0L;
for (int i = 0; i < n; i++) {
  int idx = rand() % n;
  sum2 += m[idx];
}

sleep(1);
free(m);
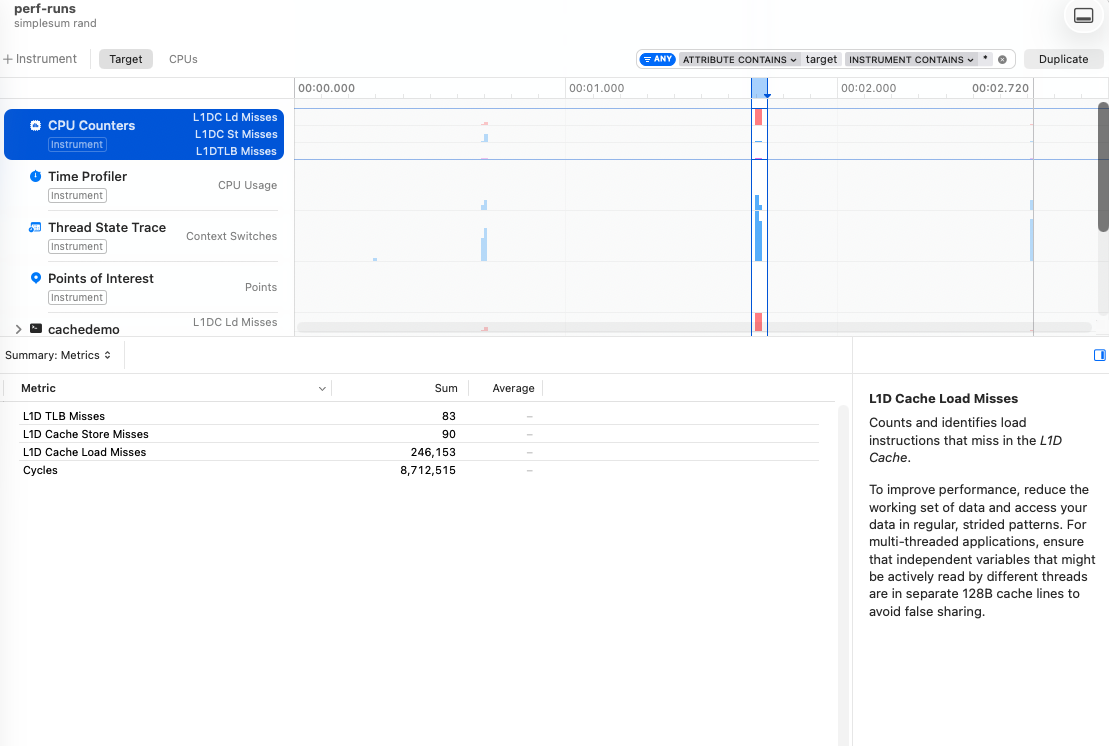
The difference here is 65 vs 246k misses.
Now in strict theory we should have 8192 (256 * 1024 * 4 = 1048576 bytes of data / 128 byte cache line), but macOS does some heavy hardware memory prefetching. So a total 65 L1D load misses, which happens during 8 context switches across 2 efficiency cores, means we’re going to have to accept that we won’t know exactly how these exactly occurred.
But compared with the 246k - by the way, this means we have a cache miss on almost each of the 262k iterations - we’re doing pretty well!
Summing all elements of a matrix
Next we’ll sum all the elements of a matrix that are stored in row-major order, first iterating through each row, and then through each column.
When we iterate through a row, we expect great cache performance as these elements are all next to one another in the cache. By column it’s less predictable generally: we could have multiple rows mapped to different cache lines and still have many hits, but chances are that we’re going to have many more misses without this focus on contiguous elements.
We’ll up the memory requirements to 256 MB by using a 8192 * 8192 matrix of 32-bit integers. The stride is an entire row of size 32 kB, so our 128/64 kB caches should be able to hold only a few rows.
int n = 8192; // n x n x 4 (int) = 256 MB
int *m = mallocFillSleep(n * n * sizeof(int));

// jump row per iteration
int sum = 0;
for (int col = 0; col < n; col++) {
  for (int row = 0; row < n; row++) {
    sum += m[row * n + col];
  }
}

// iterate full row
int sum2 = 0;
for (int row = 0; row < n; row++) {
  for (int col = 0; col < n; col++) {
    sum2 += m[row * n + col];
  }
}

sleep(1);
free(m);
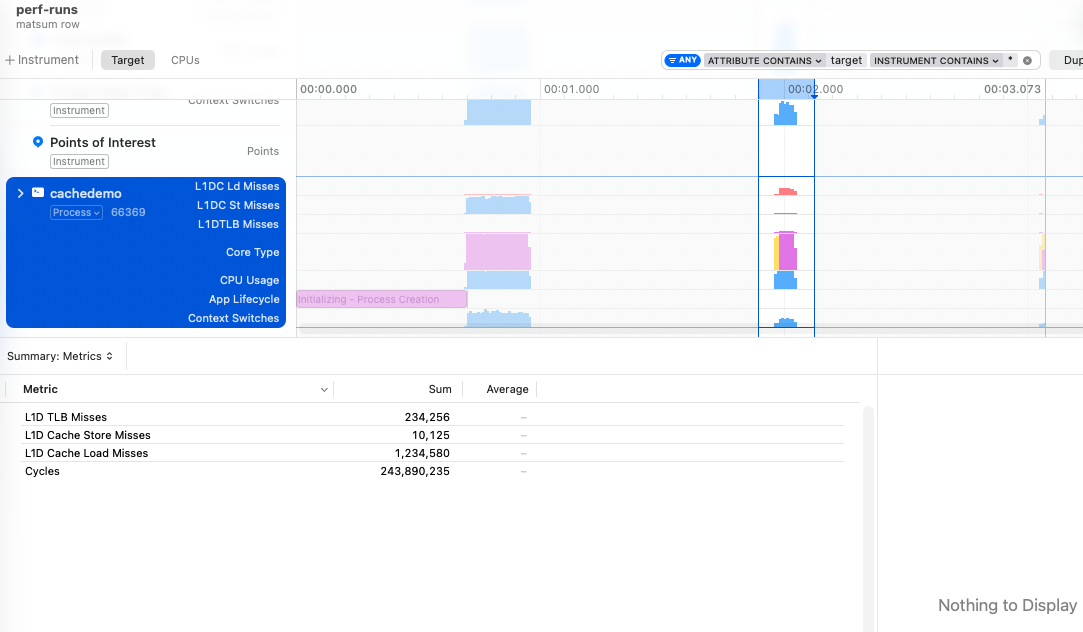
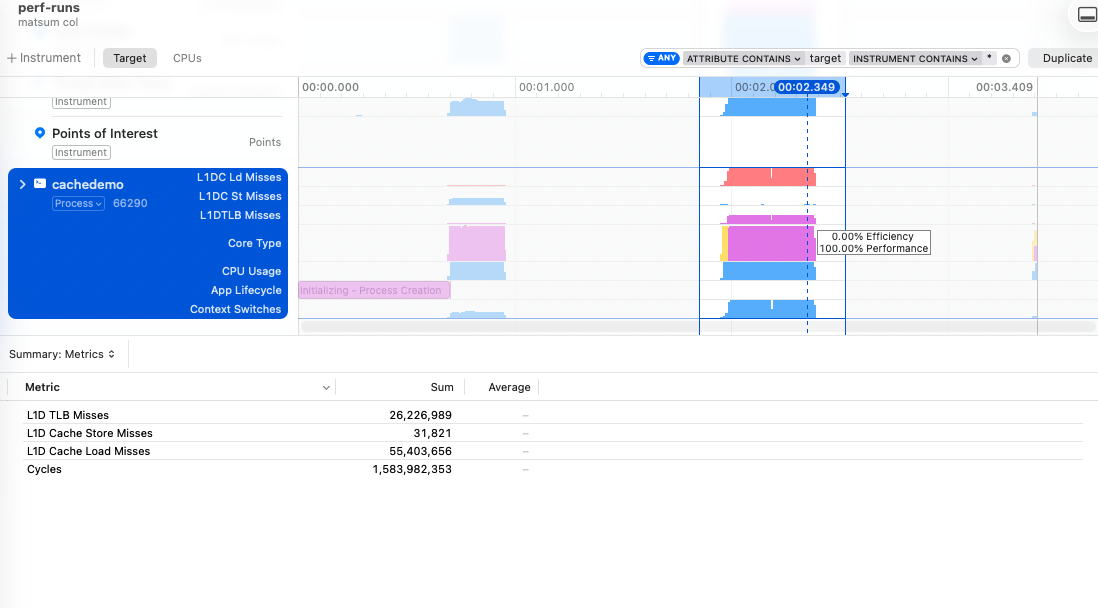
The difference between iterating the rows vs columns is 1 million vs 55 million L1 data cache misses.
The fun news about this problem is that the OS decides to move our problem to the P-cores. I wish I knew exactly how this was determined, but for now I’m just going to assume that “busy work * time spent” is what is going to get you off the E-cores.
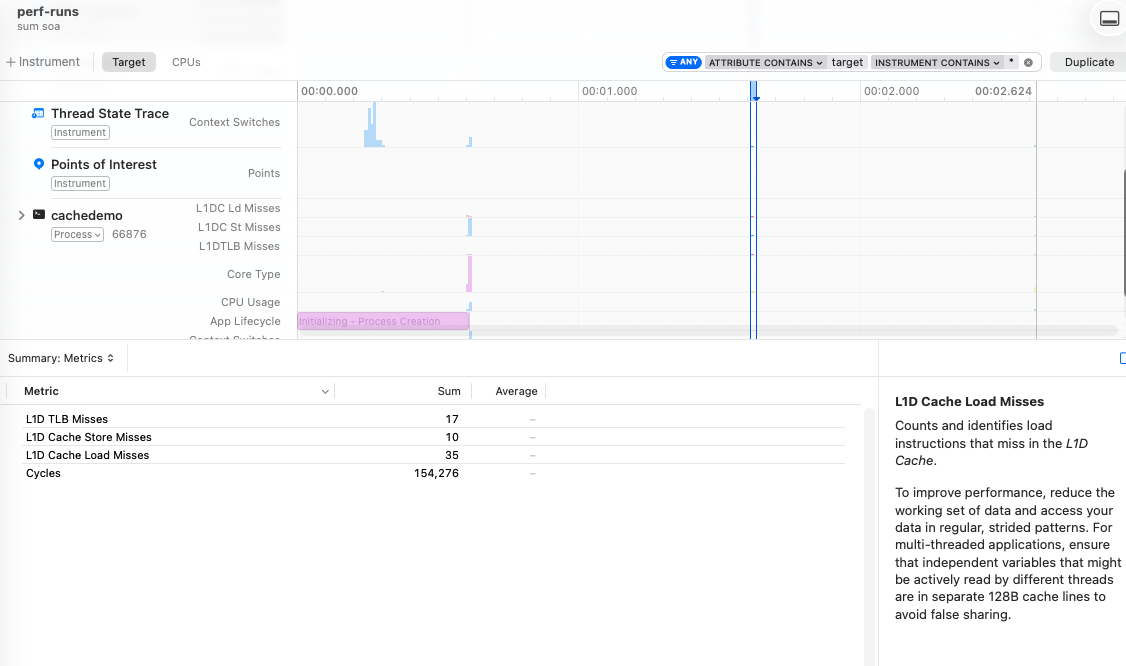
Array of Structs vs Struct of Arrays
Array of Structs (AoS) vs Struct of Arrays (SoA) is a fundamental different in data structure which concerns “how” you store related elements.
The classic object-oriented approach would be more in line with making structs/objects/classes that have many attributes, and if you happen to have many of these, these are stored in an array. Strictly speaking, the object-oriented angle would be more about grouping function and mutation directly with the data, but I will conveniently ignore this to bash OOP a little.
Iterating large structs to extract only parts of the information is a little like iterating by column in the prior example: most of what you’ve pulled into the cache is irrelevant for the next iteration. If you have systems that iterate a large number of these elements and only care about a small part - such as physics engines needing an object’s transform and velocity but not material information - then it makes more sense to store the constituent parts in arrays and actually make use of the spatial locality.
Gaming is one industry that cares a lot about this, having kickstarted the mainstream enthusiasm with the introduction of Data-Oriented Design, though there are others of course.
typedef struct {
  int id;
  float x, y, z;
  char name[512];
} Entity; // Entity[] = AoS

typedef struct {
  int *ids;
  float *xs;
  float *ys;
  float *zs;
  char *names;
} EntityList; // SoA
int n = 8192;

// single list of entities
Entity *entities = mallocFill(n * sizeof(Entity));

// single struct of many lists
EntityList list = {
    .ids = mallocFill(n * sizeof(int)),
    .xs = mallocFill(n * sizeof(float)),
    .ys = mallocFill(n * sizeof(float)),
    .zs = mallocFill(n * sizeof(float)),
    .names = mallocFill(n * 512 * sizeof(char)) // for arguments sake
};

// iterate all structs, summing just xs
int sum = 0;
for (int i = 0; i < n; i++) {
  sum += entities[i].x;
}

// iterate only the xs
int sum2 = 0;
for (int i = 0; i < n; i++) {
  sum2 += list.xs[i];
}

sleep(1);
free(entities);
free(list.ids);
free(list.xs);
free(list.ys);
free(list.zs);
free(list.names);
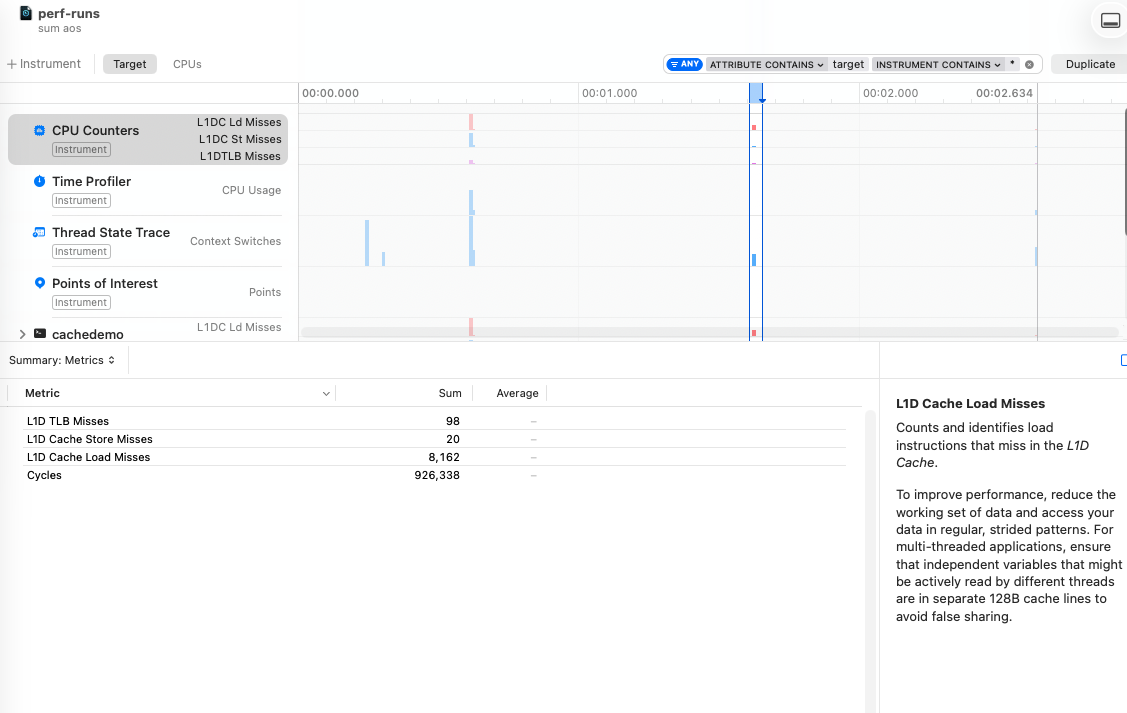
In the example here, we have 8192 entities stores as AoS and SoA and we sum up all the x positions. The result is 35 vs 8k misses, so even if this example is contrived and basic, it’s good to see that our intuition of performance gains when actually making use of the cache holds.
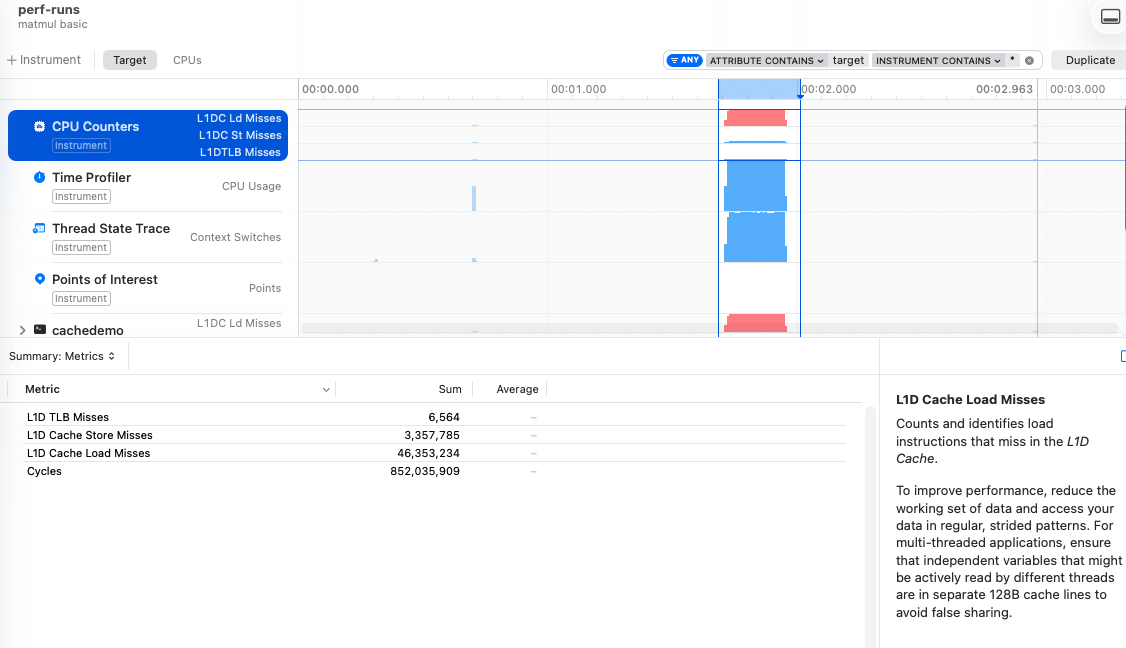
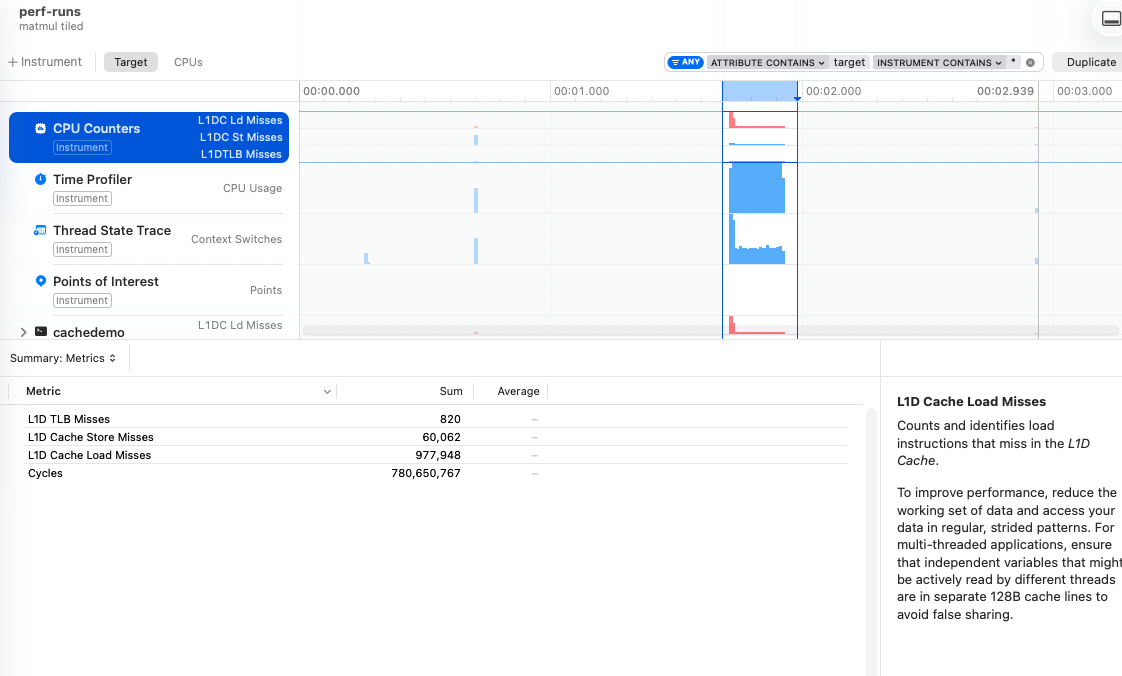
Naïve vs tiled matmul
The last example is probably the closest to a real world application, even if there are significantly better optimizations around for those doing any actual matrix multiplication.
The problem with matrix multiplication is that you are multiplying one matrix’s rows (happy cache) with another’s columns (unhappy cache). As we saw in our previous matrix example, modestly large matrices of 8k * 8k elements can only have a few rows fit in an entire L1 cache.
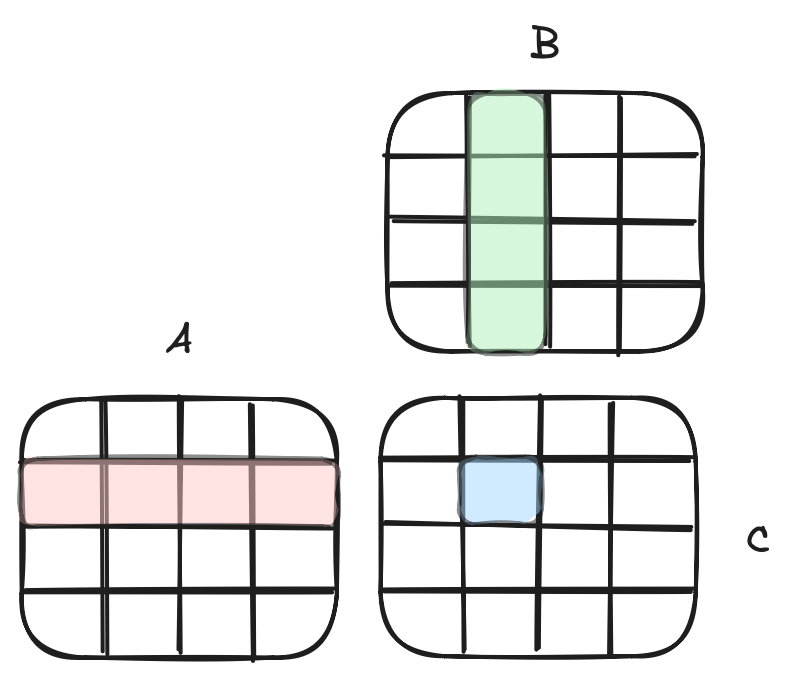
What we want is to reuse elements of the cache more, and in order to do that, we break down the matrix into sub-matrices - or tiles - and work on those. The fact that we can accumulate products in C is what makes this technique work: in the image above we could be looking at either a single complete 4x4 matrix OR each cell in A, B, C could represent its own 4x4 grid (then we’d be looking at an inner 4x4 accumulation within a larger 16x16 matrix).
int n = 512;
float *A = mallocFill(n * n * sizeof(float));
float *B = mallocFill(n * n * sizeof(float));
float *C = mallocFillSleep(n * n * sizeof(float));

// matmul - iterate A by row, B by col
for (int i = 0; i < n; i++) {
  for (int j = 0; j < n; j++) {
    for (int k = 0; k < n; k++) {
      C[i * n + j] += A[i * n + k] * B[k * n + j];
    }
  }
}

// iterate in blocks, reusing items in cache
int block = 16;
for (int ii = 0; ii < n; ii += block)
  for (int jj = 0; jj < n; jj += block)
    for (int kk = 0; kk < n; kk += block)
      for (int i = ii; i < ii + block; i++)
        for (int j = jj; j < jj + block; j++) {
          float sum = C[i * n + j];
          for (int k = kk; k < kk + block; k++)
            sum += A[i * n + k] * B[k * n + j];
          C[i * n + j] = sum;
        }

sleep(1);
free(A);
free(B);
free(C);
We focus on small 16x16 blocks to ensure that even our E-core 64 kB cache gets more hits. In this example, we go from 46M down to 1M cache misses by using the tiled implementation over the naïve one.
Summary
The tiled matmul example showed me just how relevant optimizing for different architectures is: there’s a large drop in misses when switching from the 64 kB E-core cache to the 128 kB P-core cache; modifying the block size significantly affects the misses. This illustrates how hardware specific optimizations can be, and therefore how difficult it is to come up with generic implementations that scale.
This post shows very little in the power of what you can do with Instruments, but even just this small part helped me see some actual cache miss numbers instead of being purely in the realm of theoretical numbers from our university days. Plugging this methodology into a bigger code base is hard, but it’s always possible to extract some core loop into a basic implementation that you can play around with.